
The Inventory Turnover view brings the health of your entire stock into a single screen. At a glance you see how much capital is tied up, what turns well, and where to act first.
It's a decision-making desk for purchasing, pricing, warehouse management and product management – one place that shows both the big picture and the exact numbers for a single product.
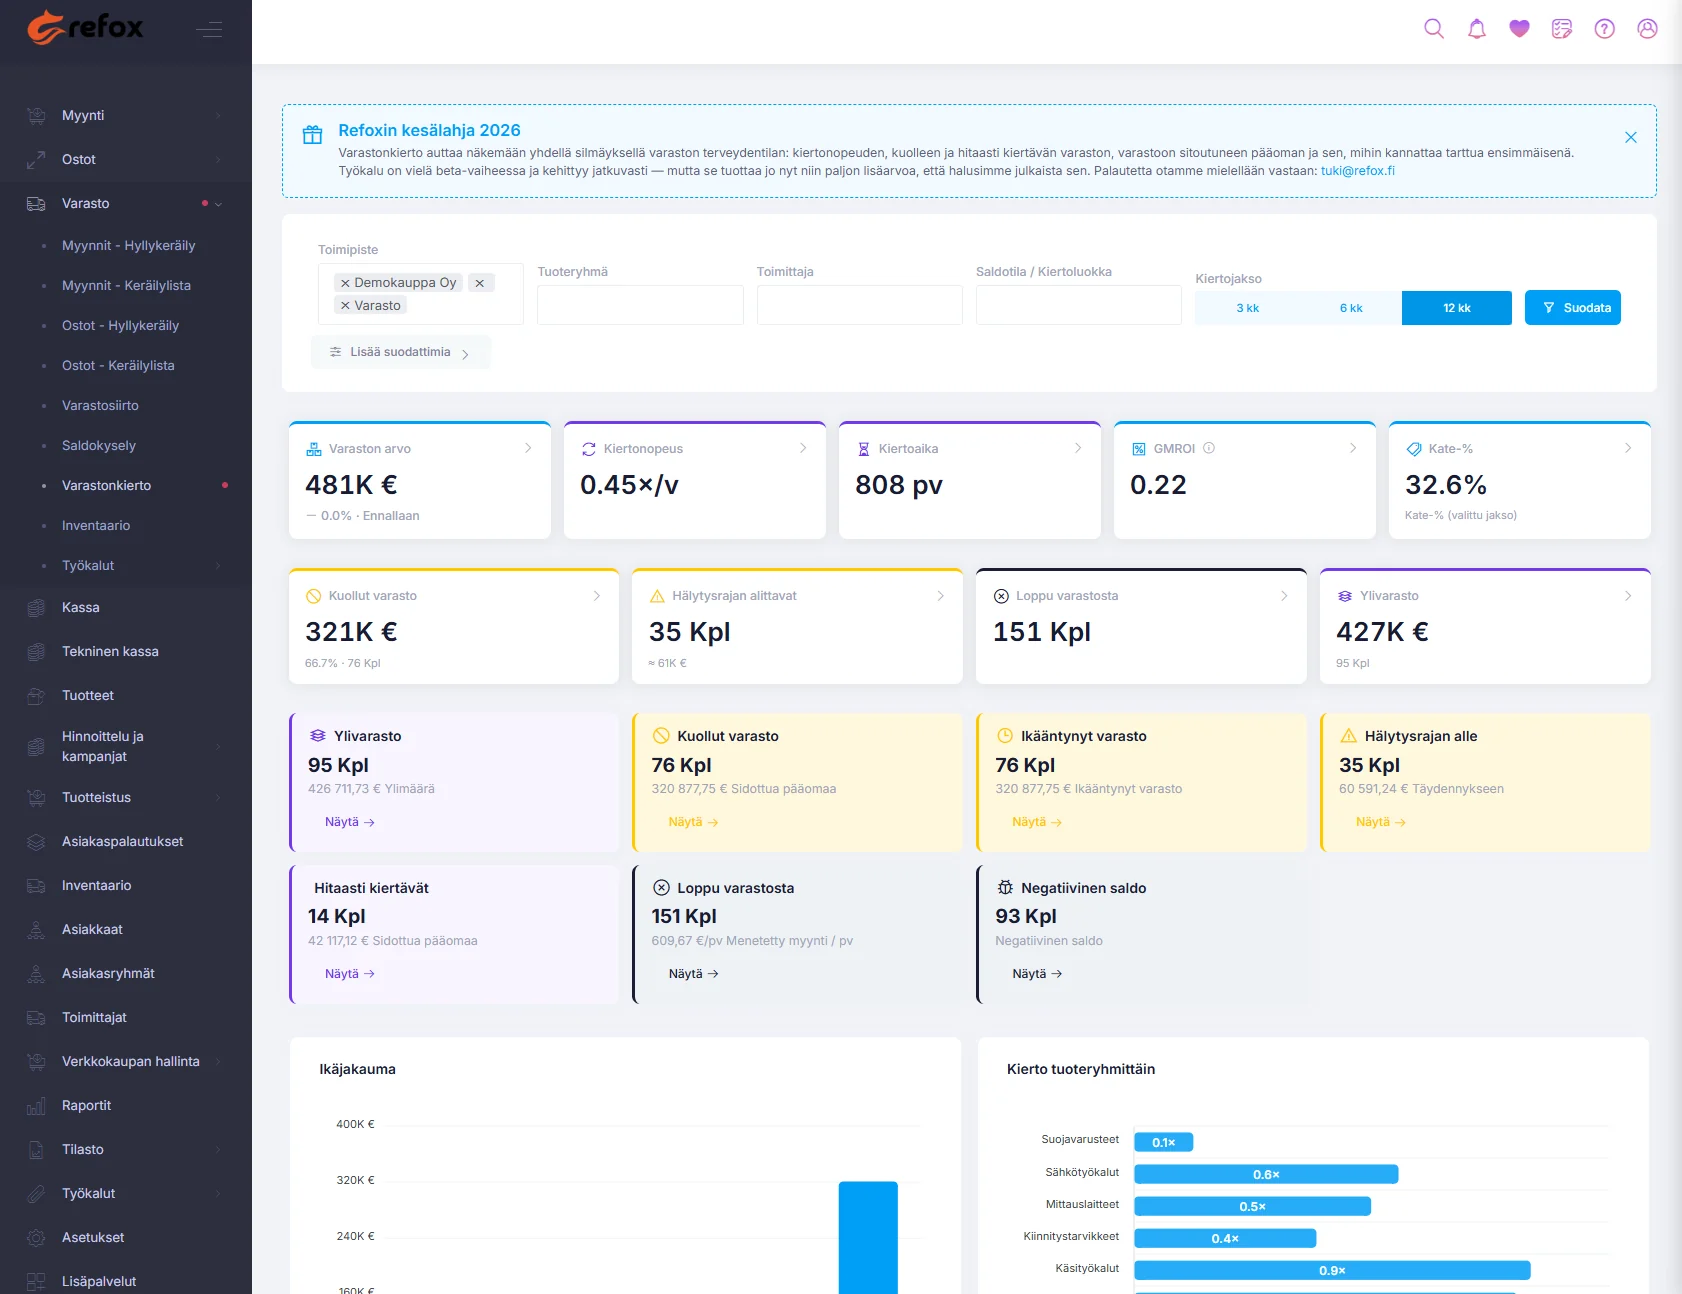
Overview at the top – KPIs tell the overall situation: how much stock there is,
how it turns, and how much capital is tied up.
Highlights and charts in the middle – they show where the problem is and how much
money is at stake.
Product list and product card at the bottom – drill down to a single product's
exact figures and per-location balances.
Click any KPI – the view takes you straight to a product list filtered and sorted by that
metric.
Stock value – the capital tied up in stock (at purchase prices, excl. VAT).
Turnover rate and days on hand – how many times stock turns per year and how many
days goods sit on average before selling.
GMROI – how many euros of margin each euro tied up in stock returns. Above 1 is
profitable, 2–3 good, above 3 excellent.
Dead stock, below reorder point, out of stock and overstock – how much capital
sits in non-moving items, what needs replenishing and where there is too much.
Highlights are your stock's most important anomalies, sorted by euro impact: each tells how many
products it concerns and what it means in euros. "Show" takes you straight to a ready action
list.
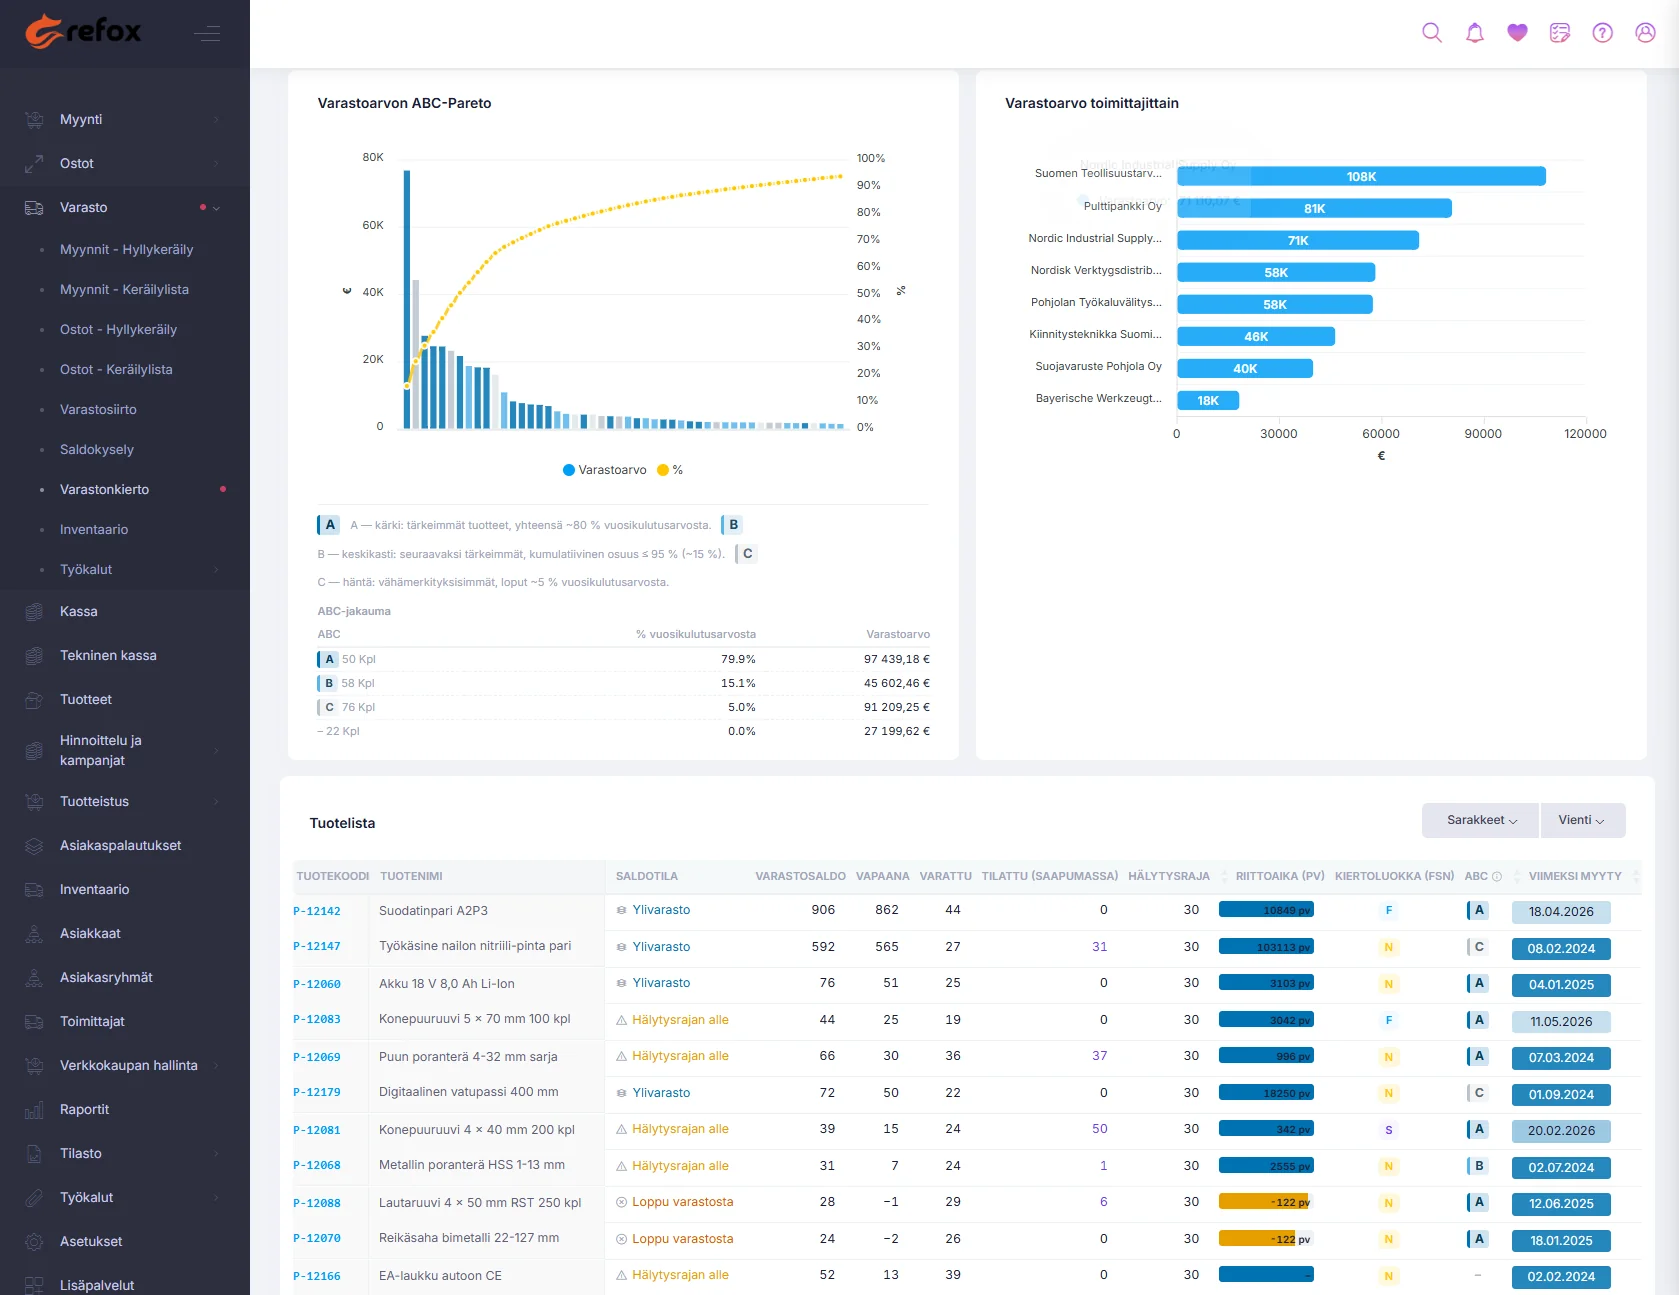
Four charts illustrate the situation from different angles: age distribution (how
old the stock is), turnover by product group, ABC Pareto (how a
small share of products drives most of the consumption) and stock value by supplier.
Filters narrow the whole view at once – location, product group, supplier, stock status and the
turnover period (3, 6 or 12 months).
Products are classified by euro importance: A is the top (80% of consumption value), B the middle, and C the long tail that can tie up a surprisingly large share of capital. The product list shows every product across 16 columns – balances, days on hand, turnover and ABC class, last sale date, stock value and margin – and lifts items needing action to the top. The product card shows a single product's real-time situation.
Buyer – start from items below the reorder point: a ready replenishment list.
Pricing – find weak-GMROI and dead-stock products for discount campaigns.
Warehouse – watch aged stock and negative balances: what to clean up or fix.
Product management – steer the assortment using ABC classes and product-group
turnover.
Tell us about your business. We'll do an assessment and show you how Refox solves your specific challenges – directly from the developer, no middlemen.